Select the green area to jump to the corresponding section.
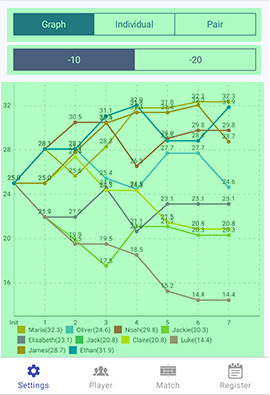
Select the green area to jump to the corresponding section.

Select the type of information to display.
Graph
Displays a graph of rating changes based on entered match results.
Individual
Displays a list of results for each individual player.
Pair
Displays a list of results for each doubles pair.

This example shows participants 11-20. Tap '-10' to show players 1-10 or '+10' to show players 21-30. To keep the graph readable, players are displayed in groups of 10.
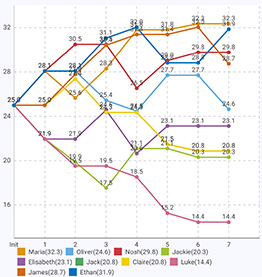
The vertical axis shows the rating, and the horizontal axis shows the round. The 'Initial' column shows the rating when the player was added to the event. Pinch in or out to zoom the graph.